How to Value a Business from a General Ledger
A practical guide to the six valuation methods buyers, investors, and advisers actually use, and how a clean general ledger can power them without a bespoke spreadsheet model.
By Jack Whitehead, AATQB

"How much is this business actually worth?" is a simple question with an inconvenient answer. Buyers, investors, lenders, and owners do not all value the same company in the same way. Some care about cash generation. Some care about comparable deal multiples. Some care about assets, risk, or how dependent the profits are on the founder.
That is why a general ledger is such a powerful starting point. It does not hand you one magic valuation number, but it does give you the raw material for several serious methods at once. If your accounts are reasonably clean, you can model cash flows, margins, earnings quality, debt capacity, and sector multiples from the same source data instead of rebuilding everything in separate spreadsheets.
Quick answer
To value a small or medium business from a general ledger, run six methods in parallel and triangulate: Discounted Cash Flow (DCF) projects future free cash flows and discounts them at WACC; EBITDA Multiple applies a sector multiple to normalised earnings; Revenue Multiple applies a sector multiple to top-line revenue (used for early-stage / SaaS); Seller’s Discretionary Earnings (SDE) is the small-business comparable, adding back owner compensation and discretionary expense; Net Asset Value sums what the business owns minus what it owes (a floor for asset-heavy businesses); Capitalisation of Earnings applies a cap rate to a single normalised earnings figure (used for stable, mature businesses). UK contexts where a formal valuation matters: HMRC EMI share scheme valuations (Form VAL231 to HMRC’s Shares and Assets Valuation team), share scheme grants generally, probate (IHT400 / IHT421), and director-shareholder transfers within close companies. LedgerIQ runs all six methods from a GL export and adds Monte Carlo simulation, sensitivity analysis, and an exit-readiness score; the maths works equally well in a structured Excel model if you prefer to own the workbook.
Free download: DCF valuation template (XLSX)
8-tab working model: Inputs, Assumptions, 5-year Forecast, FCF Build, Valuation Summary, Sensitivity (WACC vs terminal growth), EBITDA-multiple Sanity Check. Live formulas; edit your numbers, get a triangulated valuation range. No signup required.
The six valuation methods (and when to use each)
The module runs six established valuation methodologies and blends them into a weighted composite with confidence intervals:
Discounted Cash Flow (DCF)
Projects free cash flows over 5 years with growth decay, calculates terminal value via the Gordon Growth Model, discounts everything to present value using your actual WACC.
EBITDA Multiple
Applies sector-specific earnings multiples with growth premiums. Uses normalised EBITDA with owner add-backs stripped out. Supports custom override.
Revenue Multiple
Top-line valuation using sector benchmarks. Particularly relevant for SaaS and recurring revenue businesses where earnings haven't caught up with growth.
SDE (Seller's Discretionary Earnings)
Net profit plus owner compensation, personal expenses, one-offs, tax, interest, and depreciation. The standard for owner-operated businesses under two million in revenue.
Net Asset Value
Total assets minus total liabilities with a variance band. The floor valuation for any business and the dominant method for asset-heavy industries.
Capitalisation of Earnings
Normalised after-tax earnings divided by the capitalisation rate (WACC). The go-to for stable, mature businesses with predictable earnings.
The composite weighting adjusts by sector. A SaaS company weights 30% toward DCF and 25% toward revenue multiples. A professional services firm weights 35% DCF and 20% EBITDA. The system detects the sector from your chart of accounts and applies the appropriate profile automatically.
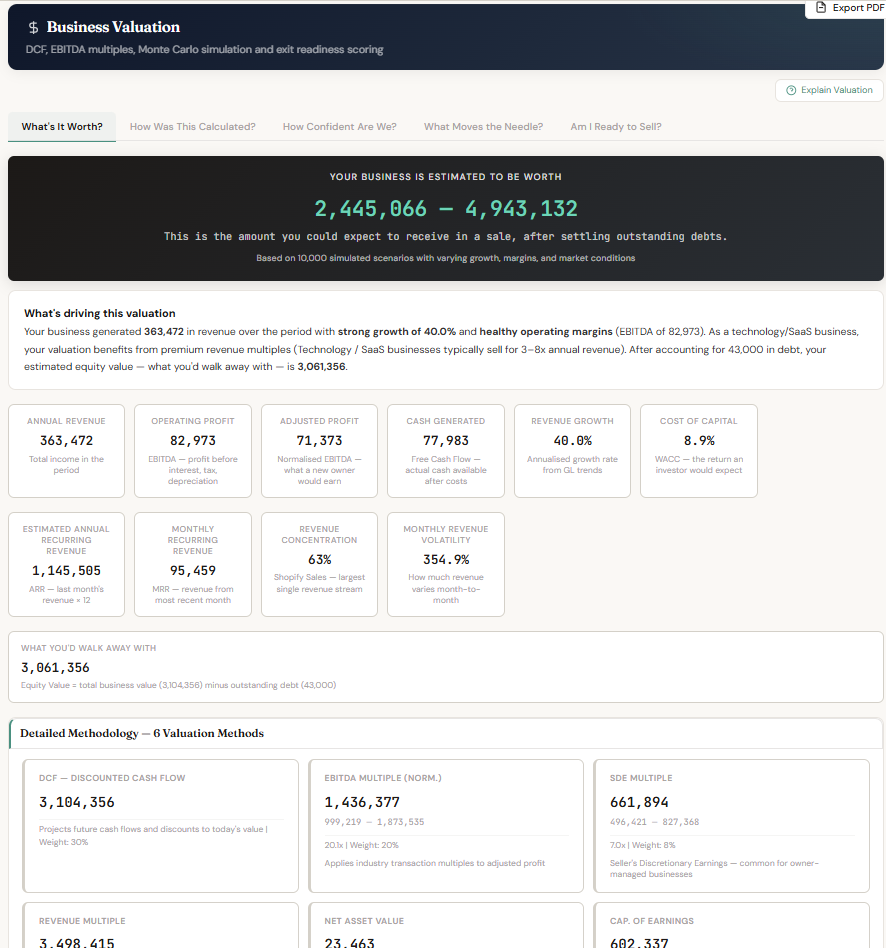
Monte Carlo: 10,000 scenarios, not one guess
A single point estimate is dangerous. Say the DCF returns an enterprise value of two and a half million. What if WACC is half a point higher? What if growth slows by two percent? What if the terminal growth assumption is optimistic?
The Monte Carlo simulation runs 10,000 iterations, each time randomly varying WACC, revenue growth rate, and terminal growth assumptions within realistic bands. The output is a probability distribution: the 10th percentile (pessimistic), 25th, median, 75th, and 90th percentile (optimistic). Instead of a single number you get a range and a confidence level.
This is the same statistical technique used by investment banks in M&A models. The difference is they charge six figures for it and take months. This runs in seconds from the same GL export you already have.
Sensitivity analysis: what moves the needle
The tornado chart shows which variables have the biggest impact on valuation when changed by plus or minus twenty percent. For most businesses the answer is WACC and revenue growth. But occasionally it surfaces something unexpected: a business where working capital changes dominate, or where the terminal growth assumption swings the number more than the discount rate.
Alongside the tornado is a radar chart showing how closely the six methods agree. Tight convergence means high confidence in the composite value. Wide spread means the business characteristics create different pictures depending on the lens and that warrants deeper investigation.
Exit readiness: the 12 dimensions that buyers care about
Valuation tells you what a business is worth on paper. Exit readiness tells you whether anyone will actually pay that price. The module scores twelve dimensions, each weighted by importance:
- Revenue growth (12%) — Year-on-year trajectory
- Revenue predictability (10%) — Coefficient of variation; buyers pay premiums for consistency
- Gross margin stability (10%) — Are margins holding or eroding?
- Operating leverage (8%) — Operating margin strength
- Working capital efficiency (8%) — Current ratio health
- Cash generation quality (10%) — Operating cash flow relative to revenue
- Debt and leverage health (8%) — Debt-to-equity ratio; target below 1.5
- Expense discipline (7%) — Profit margin trend direction
- Profit trend (10%) — Net margin trajectory year over year
- Revenue diversification (7%) — Number of distinct income streams
- Capital expenditure profile (5%) — Capital intensity relative to revenue
- Data integrity (5%) — Benford's Law analysis on GL transactions
The composite produces a score from 0 to 100 and a letter grade. An A (80+) means highly acquisition-ready. A C (50-64) means fair but with identifiable gaps to address. The breakdown shows exactly which dimensions are dragging the score down and what to fix.
UK contexts where a formal valuation matters
Most valuation literature is US-flavoured, but UK owners and advisers face specific regulatory triggers where a defensible valuation has to be filed or held on record.
HMRC EMI option scheme valuations
Companies granting Enterprise Management Incentive (EMI) options need an HMRC-agreed market value at the date of grant to lock in the favourable tax treatment. The agreed valuation is requested via Form VAL231 to HMRC’s Shares and Assets Valuation (SAV) team. SAV typically responds within 60-90 days and the agreed value remains valid for 90 days from agreement. DCF and EBITDA multiples are the most commonly accepted methods for SAV submissions, with adjustments for marketability and minority discounts.
Reference: HMRC Shares and Assets Valuation.
Probate (IHT400 / IHT421)
When a business owner dies, the value of their shareholding has to be reported on Schedule IHT413 (business and partnership interests) of the IHT400 estate return. Business Property Relief (100% on most trading-business shares held for two-plus years) often eliminates the IHT, but the underlying valuation still has to be agreed with HMRC if the estate is non-exempt or if any non-trading element is contested. Net Asset Value plus a going-concern adjustment is the typical starting point; HMRC SAV may challenge it.
Reference: HMRC IHT413 guidance.
Other UK valuation triggers
- Share scheme grants beyond EMI: CSOP, SAYE, and unapproved option schemes need defensible valuations even where HMRC pre-clearance is not mandatory.
- Connected-party share transfers: when shares move between connected parties (typically director-shareholders within a close company), market-value treatment under TCGA 1992 applies, driving both the seller’s capital gain and the buyer’s base cost. Hold-over relief under TCGA 1992 s.165 may then defer the gain.
- Divorce settlements: Family Court typically expects an independent valuation, often by a single joint expert. The valuation is binding for asset division but not necessarily for HMRC purposes.
- Bank lending and refinancing: commercial lenders increasingly require an independent valuation alongside the financial covenants on facility agreements above £500k.
Where the data comes from
Everything is derived from the general ledger. No manual inputs are required to run a valuation, though the enrichment prompt lets you refine the result with owner compensation, add-back selections, industry sector, tax rate overrides, and custom multiples.
The module auto-detects owner compensation by searching for director salary, owner draw, and similar GL categories. It identifies add-back candidates (one-off expenses, personal costs, entertaining, donations) and scores their confidence. It detects the industry sector from account naming patterns. You review and adjust, but the heavy lifting is done.
WACC is pulled from the Capital Structure Optimisation module if available, with a sensible fallback. Free cash flow is calculated from EBITDA, tax, estimated capex (depreciation as a proxy), and working capital movements. Growth rate comes from a linear regression on monthly revenue with at least six months of data.
Who this is for
Accountants advising on exit or succession. Your client asks what their business is worth. Instead of referring them to a corporate finance firm or hand-building a spreadsheet model, you upload their GL and have a six-method valuation with Monte Carlo confidence bands in front of them in minutes. The exit readiness score gives you a roadmap of what to fix before going to market.
Business owners exploring a sale. You get a realistic, multi-method view of what your business is worth before spending money on formal valuations. The sensitivity analysis shows which improvements would move the number most.
M&A advisors doing initial screening. Run a quick desktop valuation from the target's GL to assess whether the deal is in the right ballpark before committing to full due diligence.
Lenders and investors. The exit readiness score and Monte Carlo distribution give a risk-adjusted view that goes beyond a single earnings multiple.
What this replaces
A formal business valuation engagement from a corporate finance firm typically costs five to fifty thousand pounds depending on complexity, takes two to eight weeks, and requires extensive data gathering. An informal desktop valuation from an accountant costs one to three thousand and still takes days of spreadsheet work.
This module runs in seconds, uses data you already have, and produces a more comprehensive output than most desktop valuations: six methods instead of one or two, Monte Carlo instead of a single point estimate, and an exit readiness framework that most valuers never include.
It is not a replacement for a formal valuation opinion for regulatory or legal purposes. It is a replacement for every other context where someone needs to understand what a business is worth and what drives that number.