Established financial science
Enterprise-grade financial analysis
Every calculation uses established accounting formulae. Altman Z-Score, DuPont decomposition, Piotroski F-Score, and 35+ more ratios used by analysts worldwide.
Bankruptcy prediction
Altman Z-Score
The industry-standard formula for assessing financial distress risk, developed at NYU and validated across 50+ years of corporate data.
Z = 1.2\frac{WC}{TA} + 1.4\frac{RE}{TA} + 3.3\frac{EBIT}{TA} + 0.6\frac{MVE}{TL} + 1.0\frac{Sales}{TA}
Z > 2.99 safe zone · 1.81 to 2.99 grey zone · Z < 1.81 distress zone
"Your prospect has a Z-Score of 2.1, they're in the grey zone."
Performance drivers
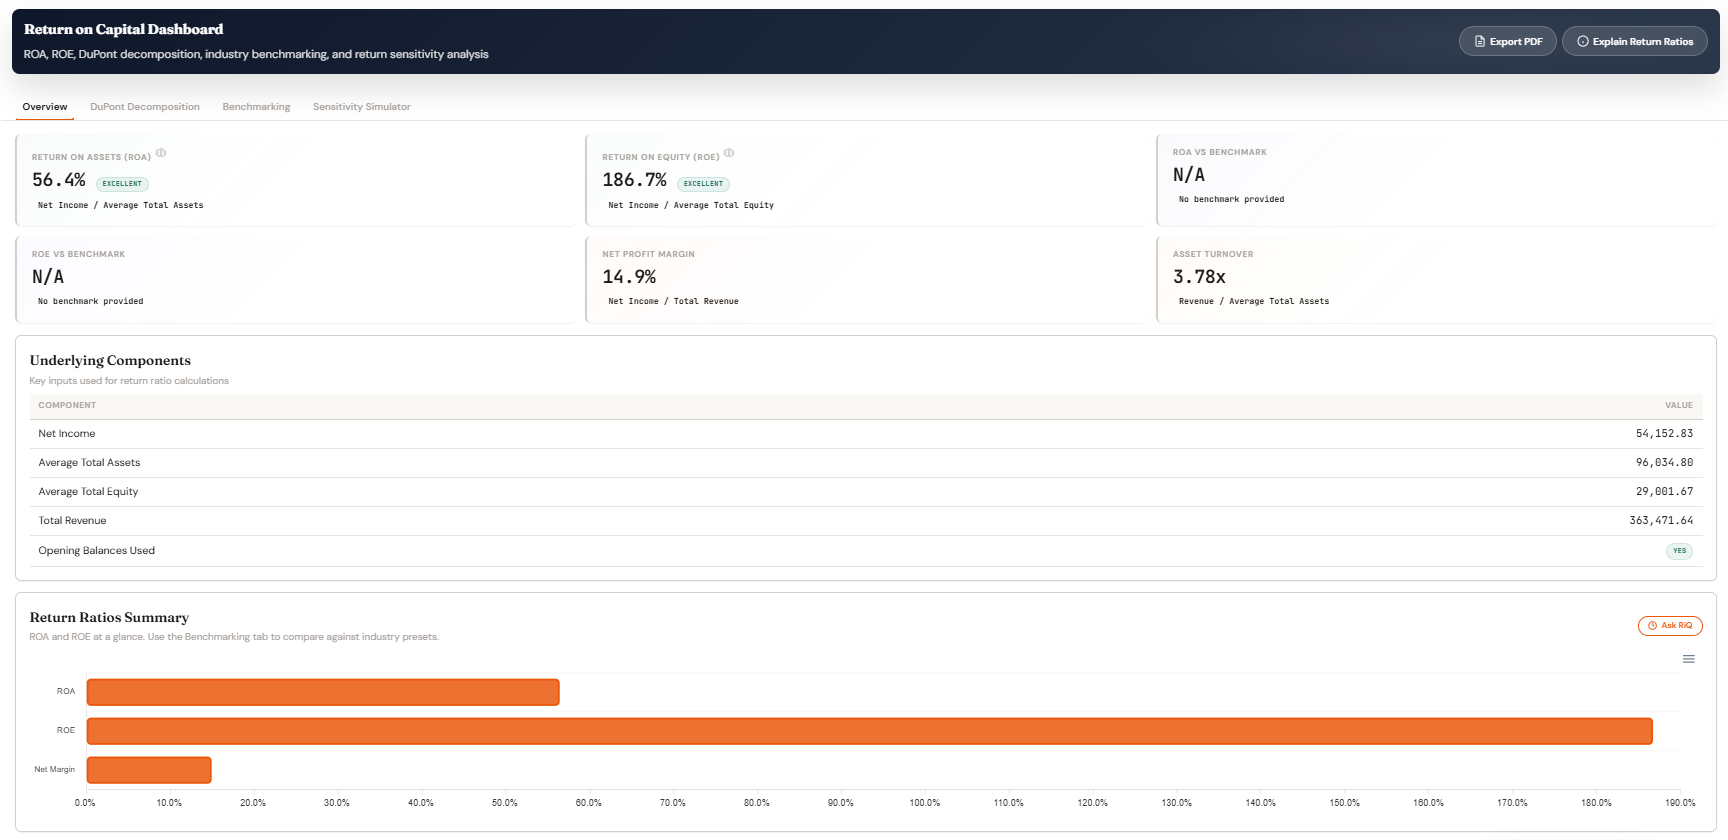
DuPont decomposition
Breaks down return on equity into three strategic components, revealing whether returns come from margins, efficiency or leverage.
ROE = \underbrace{\frac{NI}{Rev}}_{Margin} \times \underbrace{\frac{Rev}{Assets}}_{Turnover} \times \underbrace{\frac{Assets}{Equity}}_{Leverage}
Instantly identify which lever, profitability, efficiency, or financial leverage, is driving (or dragging) their returns.
"ROE is 18%, but it's all leverage, margins are thin."
Scenario modelling
Break-even & CVP analysis
Cost-volume-profit analysis with interactive what-if scenarios. See how price changes, cost reductions or volume shifts affect profitability.
BEP = \frac{Fixed\ Costs}{1 - \frac{Variable\ Costs}{Revenue}} = \frac{FC}{CM\ Ratio}
Includes contribution margin, margin of safety, and three what-if calculators: target profit, price change impact, cost reduction scenarios.
"They're operating at 12% above break-even, slim safety margin."
Working capital
Cash conversion cycle
Measures how long cash is tied up in operations, from paying suppliers to collecting from customers. Critical for understanding liquidity stress.
CCC = DSO + DIO - DPO
Combines Days Sales Outstanding, Days Inventory Outstanding, Days Payables Outstanding into one powerful metric.
"78-day cash cycle, they're funding 2.5 months of operations."
Composite scoring
Financial health score
Combines the Altman Z-Score with Piotroski F-Score (9-point fundamental analysis) and liquidity metrics into a single 0 to 100 health rating.
Health = w_1 \cdot Z_{norm} + w_2 \cdot F_{score} + w_3 \cdot Liquidity
Piotroski F-Score evaluates 9 binary signals: profitability (4 points), leverage/liquidity (3 points), operating efficiency (2 points).
"Financial Health: 72/100, good but watch the leverage."
Risk detection
Anomaly detection
Intelligent flagging of unusual transactions using materiality thresholds, not just statistical outliers. Catches control violations and structuring patterns.
Materiality = max(£5000,\ 2\%\ Rev,\ 0.5\%\ Assets)
Categorises findings by severity: Critical (cash irregularities, control violations), Medium (timing anomalies), Low (statistical outliers).
"3 critical anomalies flagged, manual cash journals over £50k."